The Super Bowl continues to be one of the largest televised events of the year, but the way we tune in is rapidly shifting. Paramount+, which is streaming Super Bowl LVIII this year, is expecting to see record streaming numbers for the match between the Kansas City Chiefs and the San Francisco 49ers. And data from the ratings giant Nielsen points to an even larger trend, which could explain why more companies, including Disney, Fox, and Warner Bros. Discovery, are focusing on sport streaming.
According to data Nielsen shared exclusively with Fast Company, half of U.S. consumers who watched the Super Bowl last year tuned in via a cable box or antenna, down 18% from the year prior. Meanwhile, Super Bowl viewership on smart TVs and devices like phones and laptops jumped by 75% and 57%, respectively. The same trend tracks with the NFL regular season which saw similar increases and decreases across the same viewing sources.
How People watch the Super Bowl
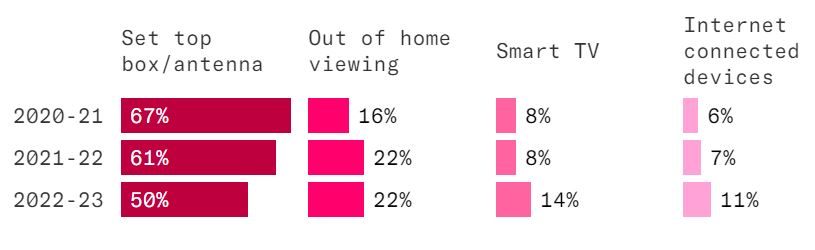 Source: Nielsen
How people watch the NFL regular season
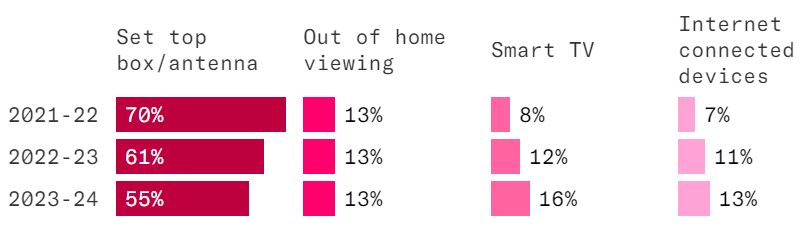 Source: Nielsen
The numbers are even more pronounced among Gen Z and millennials. Nielsen research shows that the portion of 18- to 34-year-olds who watched the Super Bowl at home via a cable box or an antenna plunged to just 29% last year. Meanwhile, their viewing of the Big Game on smart TVs and internet connected devices each grew by more than 50% compared to the year prior.
How 18- to 34-year-olds watch the Super Bowl
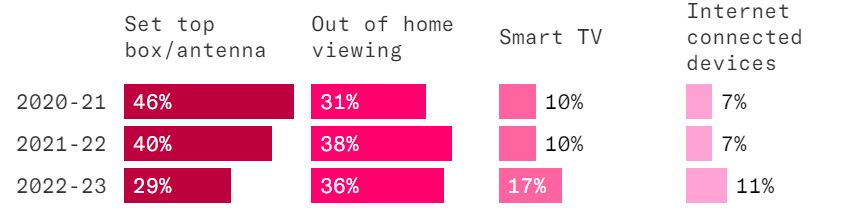 Source: Nielsen
Fast Company spoke with Deirdre Thomas, Nielsen’s chief product officer, about the data, current viewing trends, and how the firm measures a large TV moment like the Super Bowl. (This interview has been edited for length and clarity.)
What stood out to you from the data?
As you look at this data, what is super interesting is sports is always the top programming people watch on television. When I talk about television, I’m talking about the modern definition of television. When you and I sit down to watch TV, we don't say, "I'm going to watch a little streaming tonight," or "I'm going to watch a little linear tonight," we just say, "We want to watch television." Sports has always been the draw, and big audiences come for it. The NFL—in particular the Super Bowl—draws tremendous audiences. This data is representative of the overall trend we see in the market. You see a move away from an old cable bundle and instead a move to internet connected devices to access television.
The other thing is, when you look at the younger demographic, you see the trend is even more heightened, which makes sense. I grew up in a world where an antenna was bunny ears and cable was expensive. The norm for [18- to 34-year-olds] is to access things via the internet.
Can you share how Nielsen measures this type of audience data?
Our ingredients for that measurement are a number of things. First of all, we have big data from five different providers for a total of 45 million households and 75 million devices. That's from Roku, Vizio, Comcast, Dish, and DirecTV. That big data gives us a huge amount of scale to really understand what households are watching in the United States. But what the machine data lacks is actually who the people are. When you take that vast amount of data, you need to make sense of it, and this is true of any sort of big data set. You need a truth set, which in the case of Nielsen is our cross platform panel, which is 42,000 homes in which we can measure everything that people are watching on linear television, as well as on streaming.
The role of that panel in our measurement is to calibrate and make sense of the big data and understand who lives in that household. For example, I've got two kids, a husband, and a nanny who might have been tuned in, and that helps us make sense of [the data] and accounts for things like co-viewing.
How does Nielsen measure linear consumption versus streaming on these viewing sources?
Dish, DirecTV, and Comcast give us a reliable measurement across the longtail of linear consumption. We get our smart TV [data] from Vizio and Roku. More than half of our panel has streaming meters, which actually captures the streaming activity that happens within that home. We have mapped the computer, mobile devices, and the connected TV itself so that we're capturing streaming consumption across all devices in a home.
The Nielsen data shows that over one-fifth of the people who watched the Super Bowl last year were away from their homes. Can you explain what out-of-home viewing is and how that’s measured?
Out-of-home viewing what happens in a bar or an airport, or wherever that may be. That’s really important in particular for large sports events like the Super Bowl because people congregate to watch things they really care about. So, there's more likely to be viewing happening in these big spaces and it's important to count for that.
We measure that via a wearable meter that our panels actually bring out. That enables us to know what they're viewing regardless of where they are.
What other trends are you seeing?
You see all kinds of content, including live sports, moving away from linear into streaming. That’s an interesting change you’ll see as more streaming platforms get some rights or exclusive rights to distribute sports content. It’s a change from when streaming first started; it was largely kind of on demand. You sit down and look at the library and decide what you want to watch. Streaming is increasingly a combination of that on-demand behavior and appointment viewing because most people don't watch the Super Bowl on a time delay. They sit down, and they want to watch the game when it's happening. So, that’s a trend you're seeing more and more as different rights and deals get negotiated and move toward streaming.
Source: fastcompany.com