The share of delayed TV viewing exceeded 16 % in January this year, increasing by 3.8 percentage points year-on-year. Live (linear) viewing accounts for almost 84 % of total TV viewing. These figures refer to the over-15 age group and are based on the official ATO-Nielsen Admosphere TV audience measurement.
The share of delayed viewing has thus increased by about a third over the past year, confirming predictions that the share of delayed viewing can be expected to increase further (time-shift, or watching programmes on TV within 7 days of their broadcast).
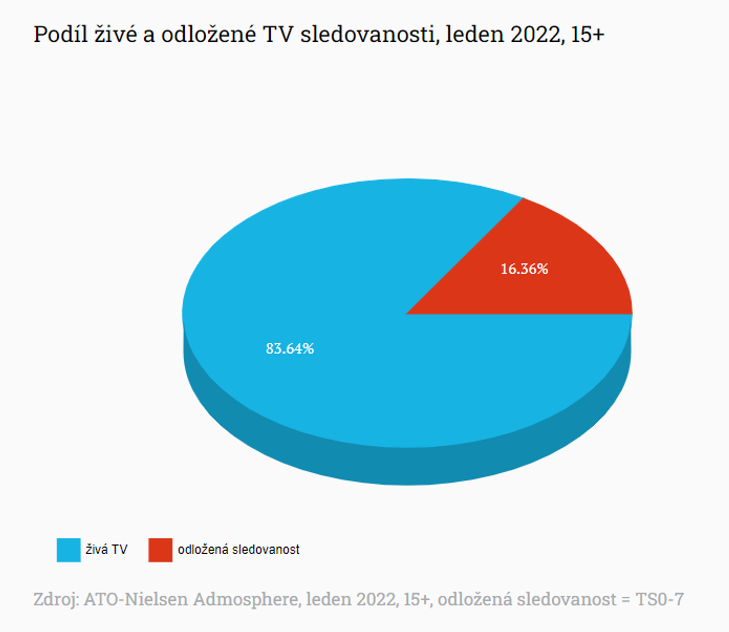 Share of live and delayed TV viewing, January 2022, 15+; Source: ATO-Nielsen Admosphere, January 2022, 15+, delayed viewership = TS0-7
live TV (blue)
delayed viewership (red)
Delayed viewership then varies by viewer group. Younger viewers have a higher proportion than the general population. For example, in the 15-34 age group, delayed viewing accounted for 27 % of all TV viewing this January, compared to 11 % in the 55+ age group.
The result only includes delayed viewing on TV screens, not delayed viewing on computers.
If we include other ways of watching video content (video on demand on PCs, tablets, mobiles, social networks, etc.), the share of traditional TV viewing is roughly half (50 %) of all video content watched, according to available estimates from research agency Kantar. Video-on-demand (SVOD, AVOD, TVOD) accounts for around 25 %, with the remainder coming from storage or social media viewing.
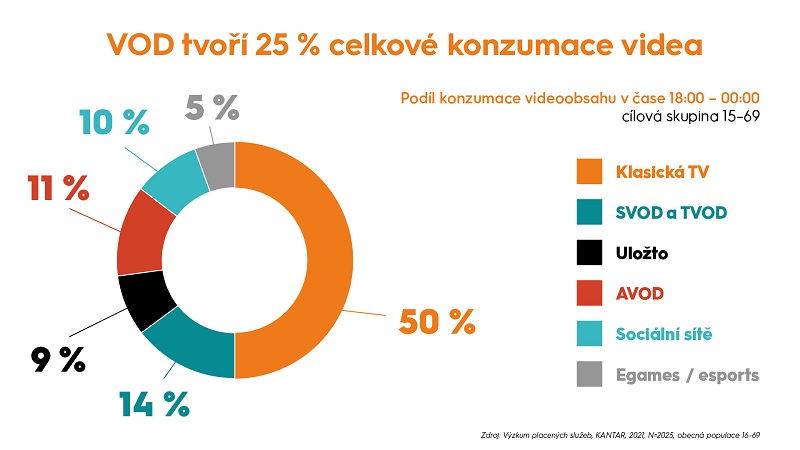 Source: Kantar Paid Services Research 2021, N = 2025, general population 16-69
Source: mediaguru.cz